Discover the insiders guide to your website


Gain insight into what residents are enjoying most about your community website. Find out what’s working, what’s not, and overall resident adoption. From visitor statistics to information about your most viewed pages, we encourage administrators to familiarize themselves with the “Analytics” section.
In this article, we’ll take a journey through the “Analytics” section and learn about the facts that are available and how they can be applied to improve your community website.
Visitor tracking
See how often your website has been visited as well as the total number of times the pages have been viewed, the average number of pages viewed per visit, and the average time someone spends on your website.
This information can be pulled for the last 7 days, 6 months, or as far back as one year. Click on the timeframe that you’d like to see and the visitor tracking analytics and graphs will update accordingly.
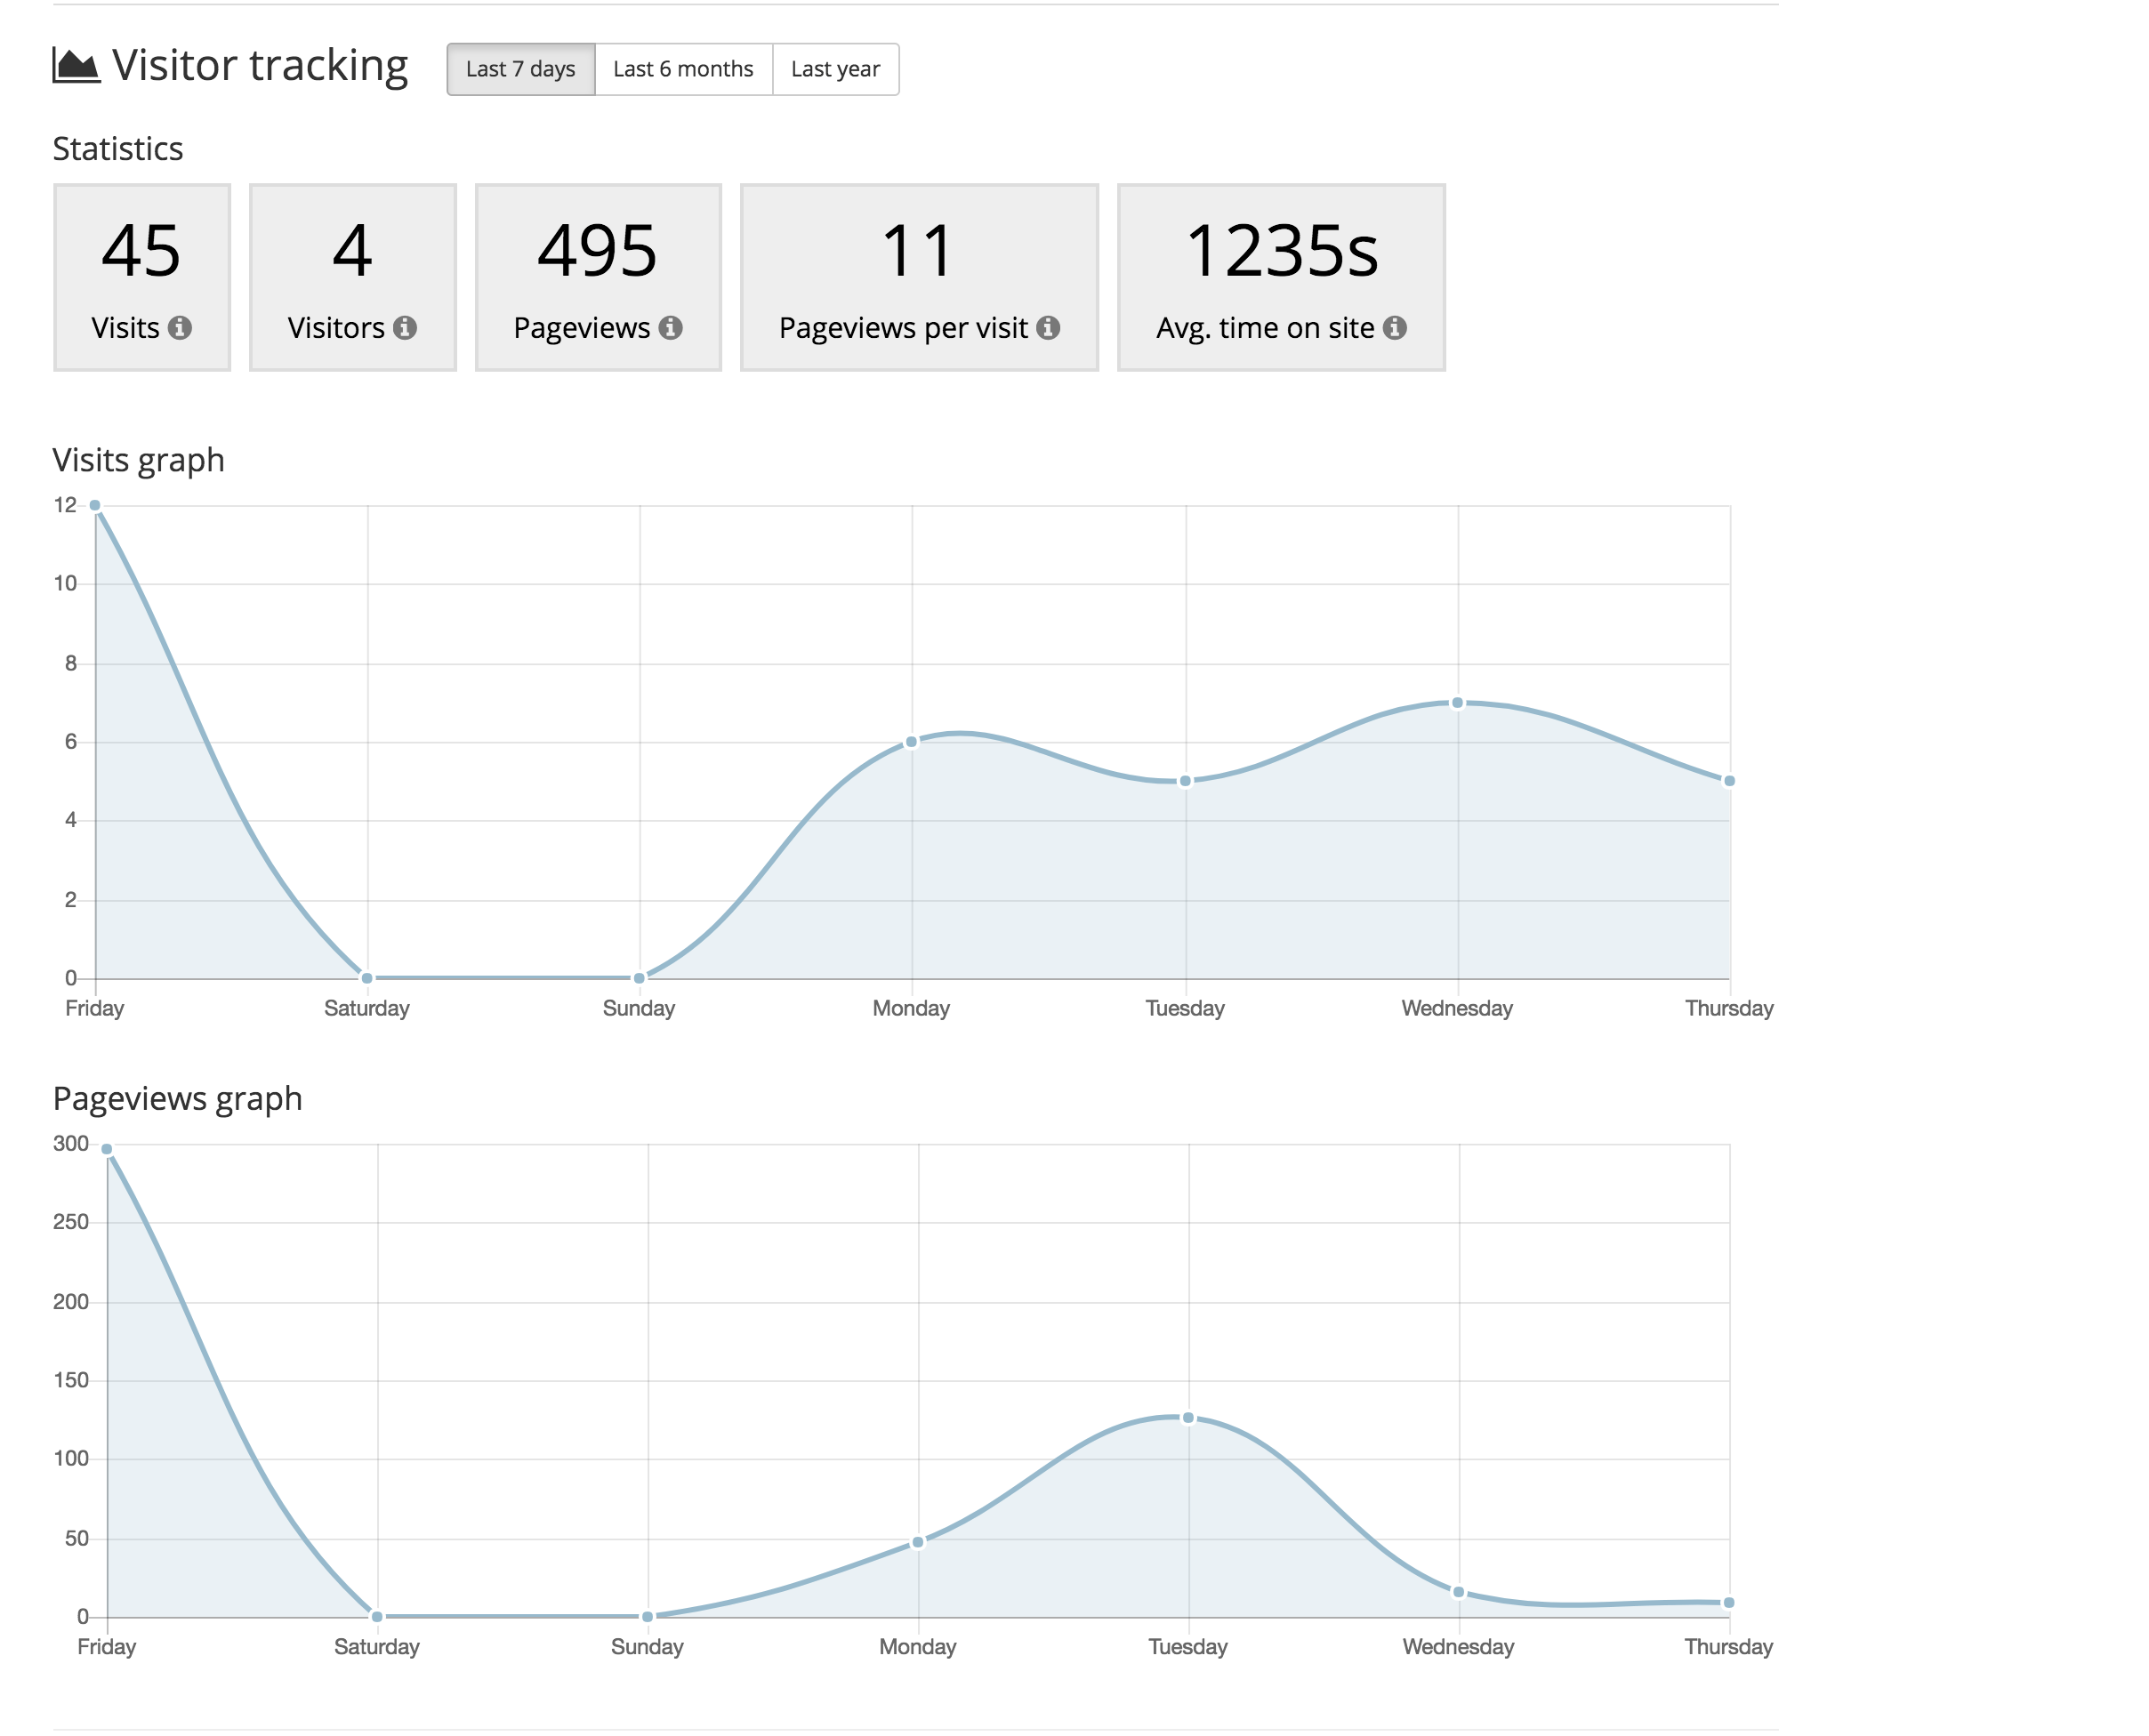
Terminology
“Visits” represents the total number of times your website has been visited or viewed. This number does not just figure residents with an account on your website, but rather anyone in the world that has visited your website and viewed one or more pages.
“Visitors” indicates the total number of people that have viewed your website. Since your website may be viewed from multiple devices, it’s possible for the same person to be counted more than once.
Therefore, if someone viewed your website from a desktop, mobile phone, and a laptop, that person would be included in the “Visitors” number three times. Similarly, if five people visited your website using one device, they would each be counted once.
Members
Monitor the number of members registering for accounts on your website. The “Registered over time” graph is a great visual to track whether the total number of new members joining your website is increasing or if things have stabilized.
If your website is fairly new, it’s likely that you’ll see a steady incline of the number of accounts being registered in the first few months. If your community is established with a low resident turnover, the graph will eventually level off.
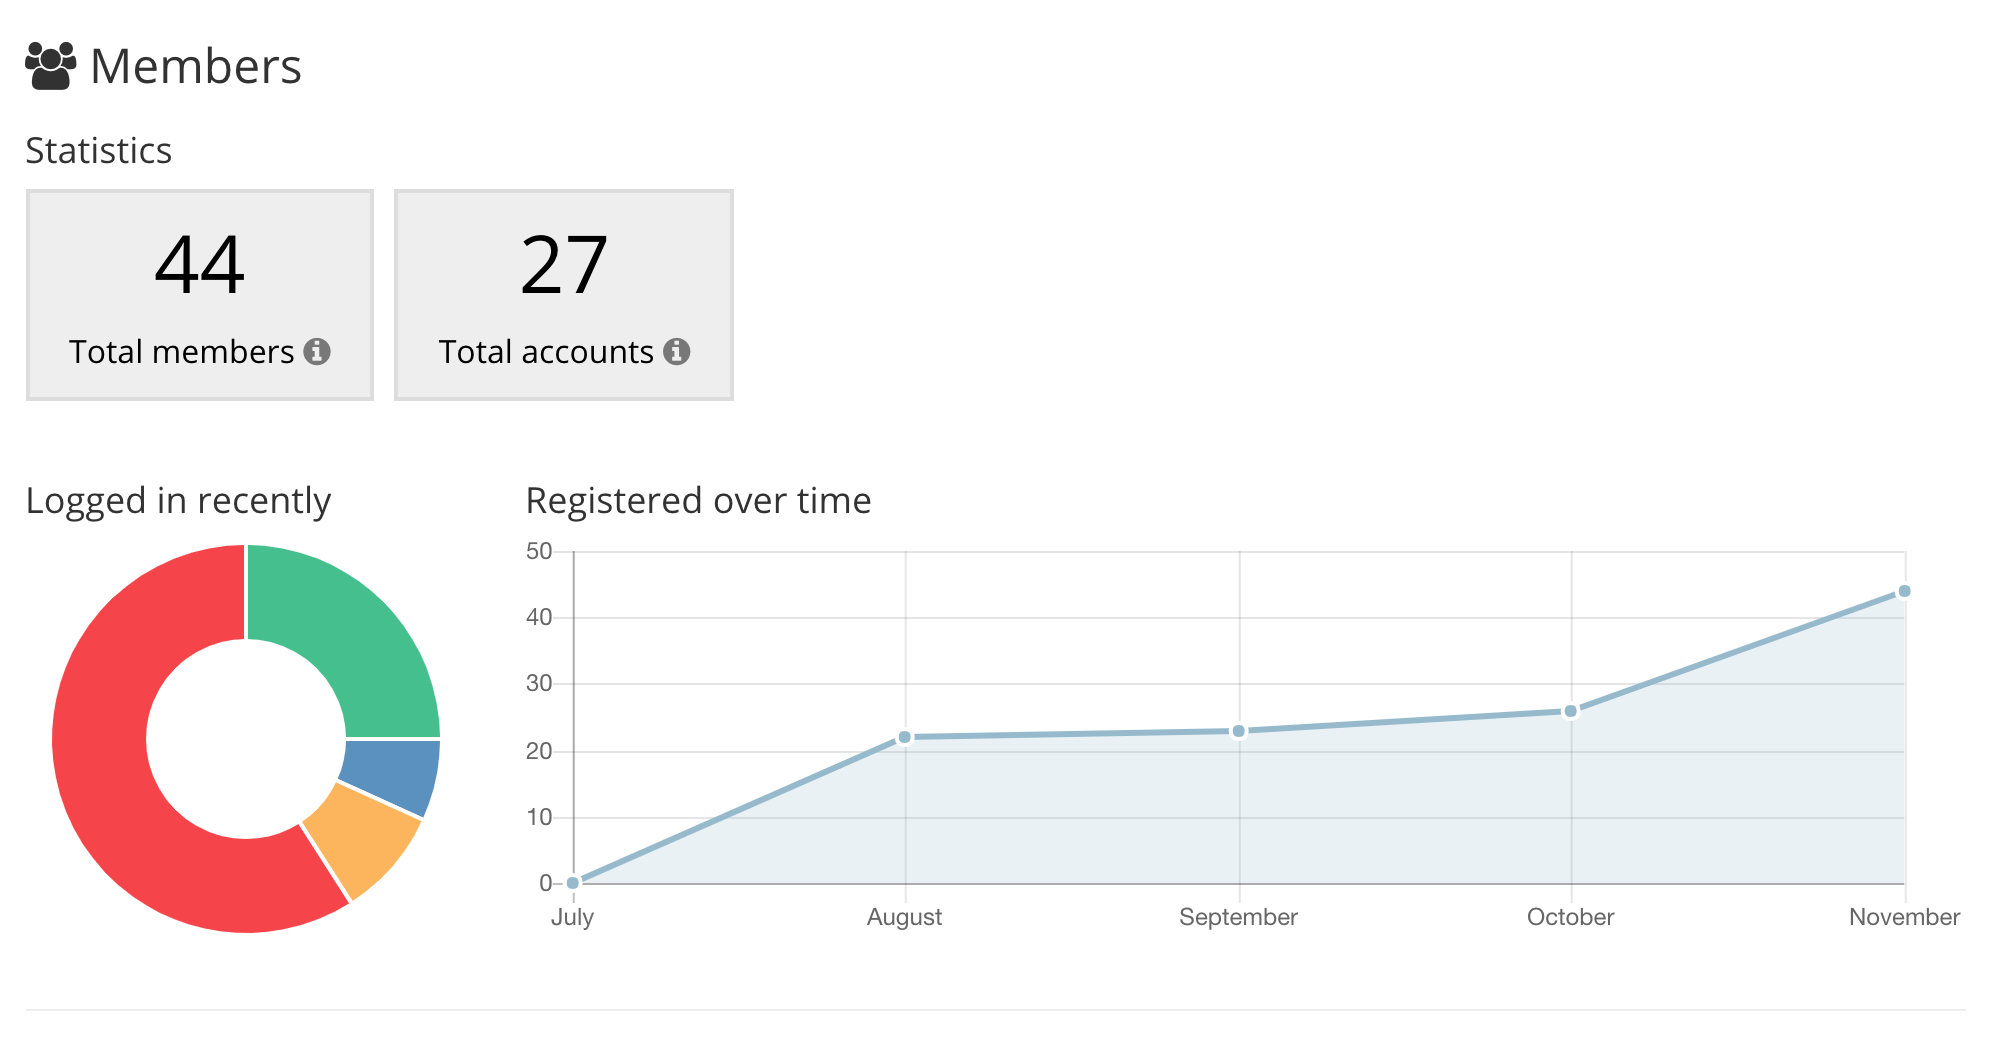
Engagement
Another way to review resident involvement is to check the number of residents that have recently logged in. The “Logged in recently” donut graph displays the number of residents that have logged in within the last 30 days.
You might see a spike in this number around certain times of the year, such as when annual payments are due. If you have online payments set up, you can expect more residents to log in to pay those dues within a 30-day time frame than you would ordinarily see throughout the other months of the year.
It’s important to note that if you have pages that are visible to the public, it’s likely residents are still engaging with your website and viewing those pages, even if they aren’t logging in (since it’s not necessary to log in to view a public page).
Pages
This section is especially useful for finding out which of your pages are being viewed the most, or very little, within the last 6 months. Knowing this information is the first step in understanding why residents are not visiting certain pages.
Perhaps a page that you thought would be visited often by your residents doesn’t seem to be piquing their interest. Check on where you’ve placed the page within your page list. Is it listed where residents can see it? Does it have a clear title for residents to quickly identify what its purpose is for?
If everything seems to be looking okay, consider sending a blast email to highlight that page and let residents know a bit about it. Sometimes residents just need to learn more about the function of a page to understand its benefit. Then, sit back and check to see if that page moves up the ranks!
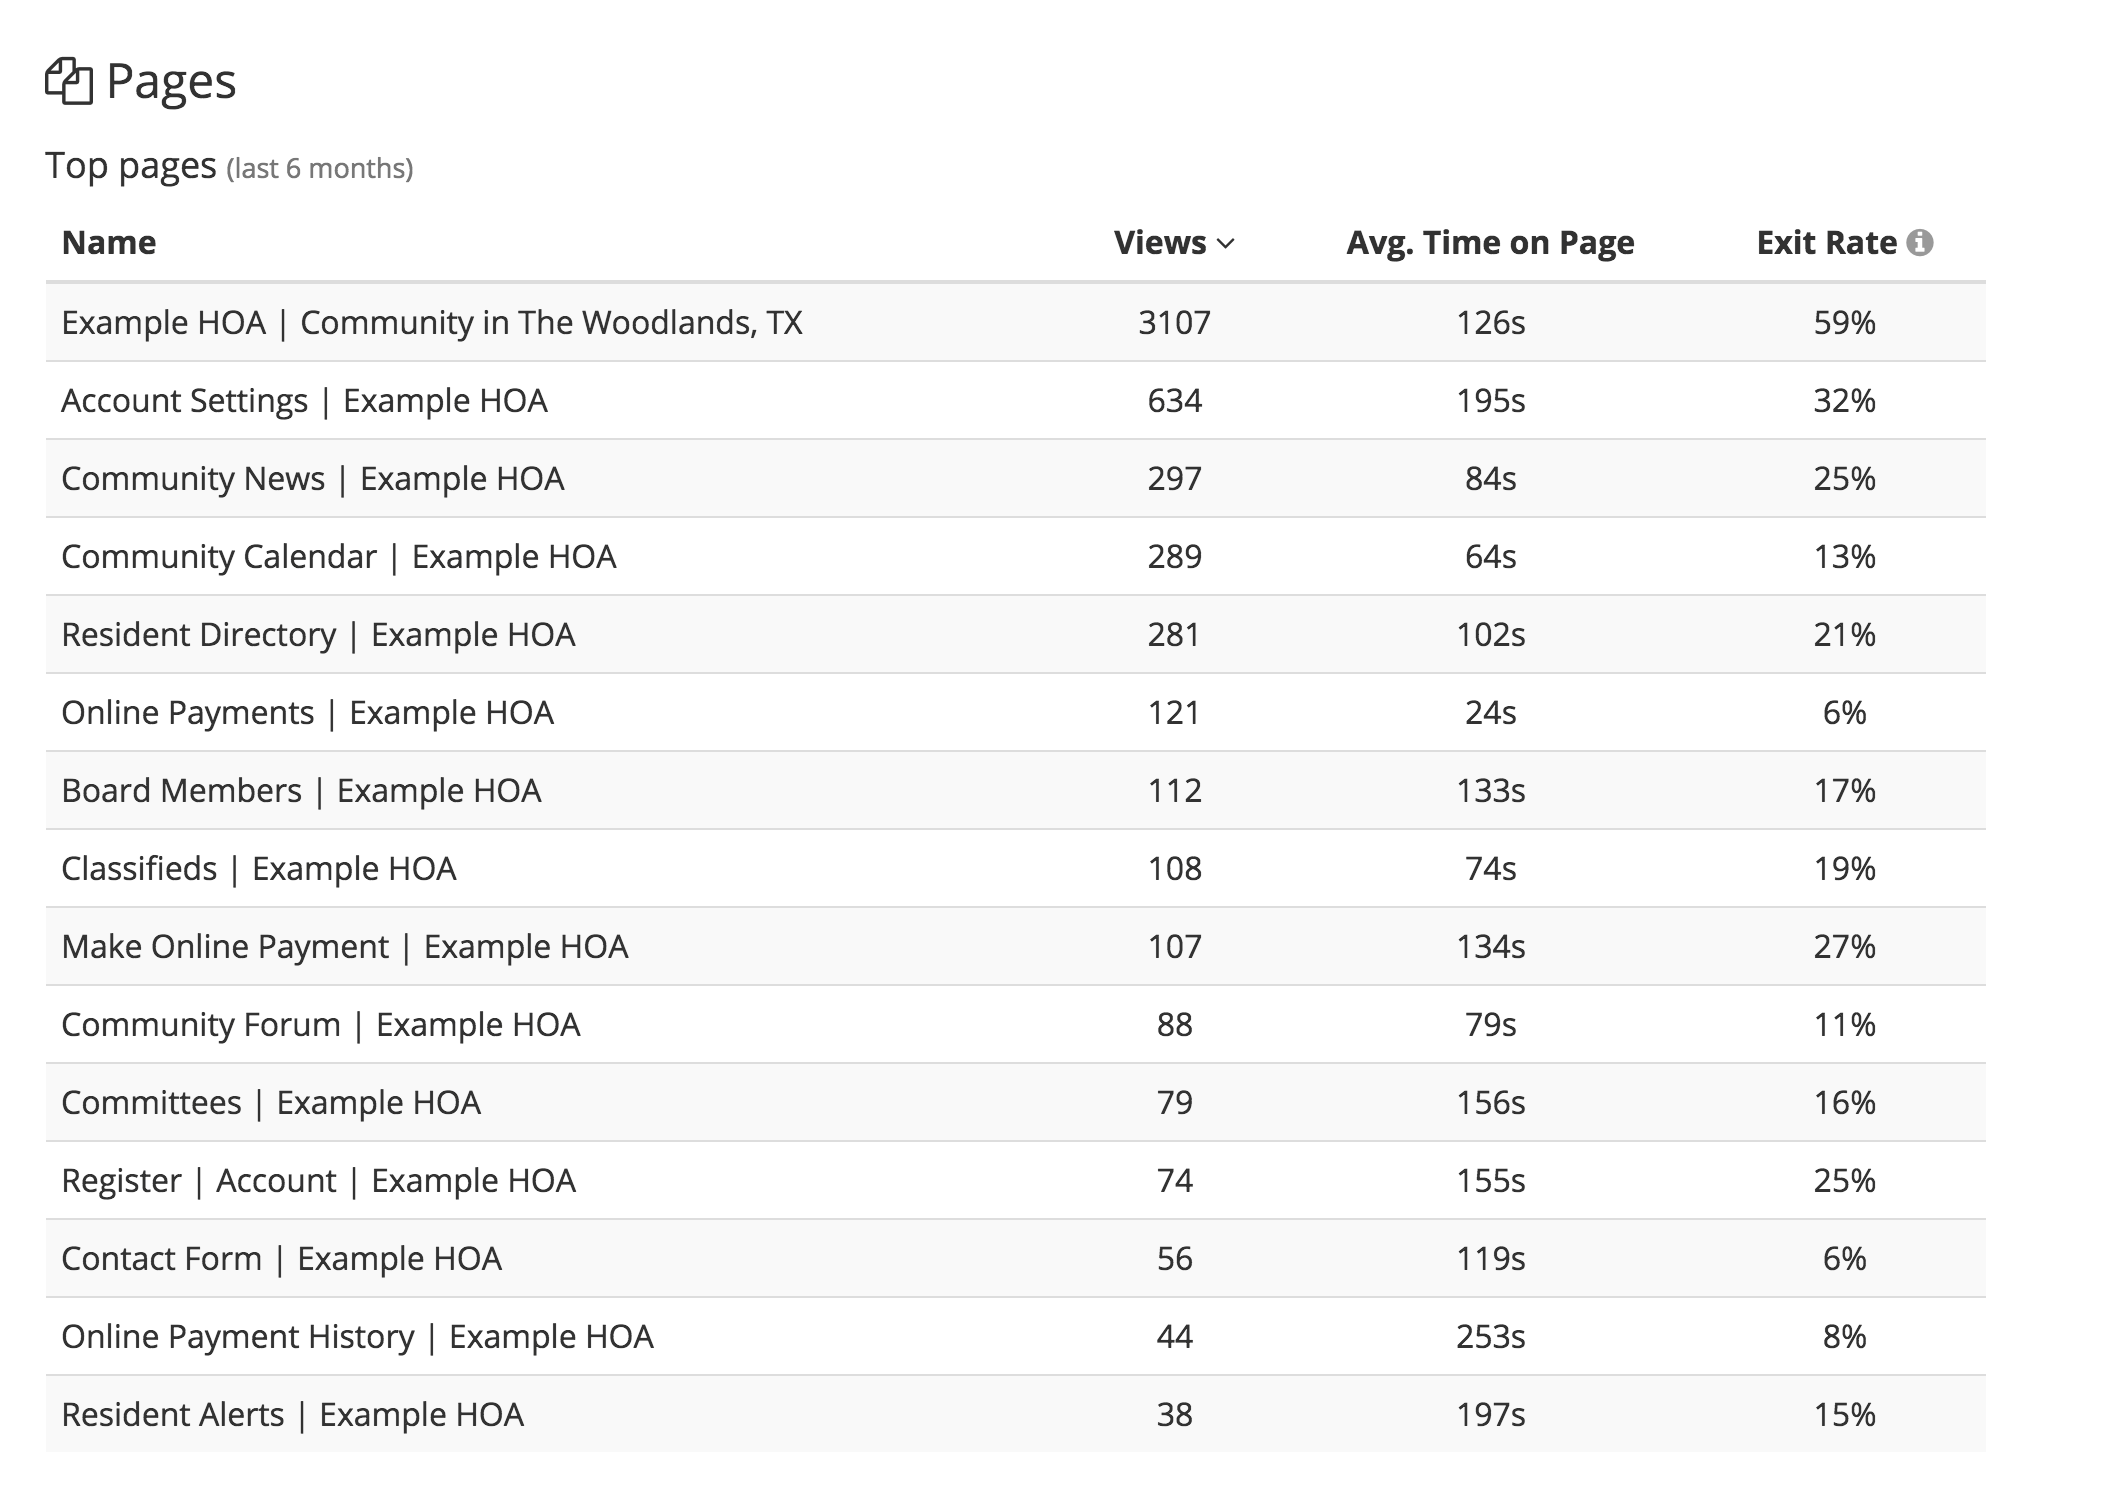
In addition to the total number of views, you can observe the average time spent on a page, as well as the exit rate. The exit rate is a percentage of visitors that did not view another page after viewing that particular page. A high exit rate isn’t necessarily a bad thing. This generally means that the visitor found what they were searching for and left.
There are some pages, however, that aren’t typically pages that you’d want people to leave on such as your homepage and the registration page. Generally speaking, people will usually visit other pages after clicking on these two. Therefore, if you find that residents are leaving after viewing your homepage, consider using the “Surveys” feature to collect feedback from registered residents on how to improve your website.
Wrapping up
Tracking the impact your website is having on residents can prove to be an essential part of supporting your community and managing your website.
The analytics section is a great resource for determining the benefits your website is providing, as well as residents’ overall involvement. Therefore, we encourage you to stay in the loop and check the facts on a regular basis.